HIGHLIGHTS
- "Tesla has reduced the prices of its two most expensive models, raising concerns about fading interest in its cars and whether the company can generate enough cash to pay all the bills.
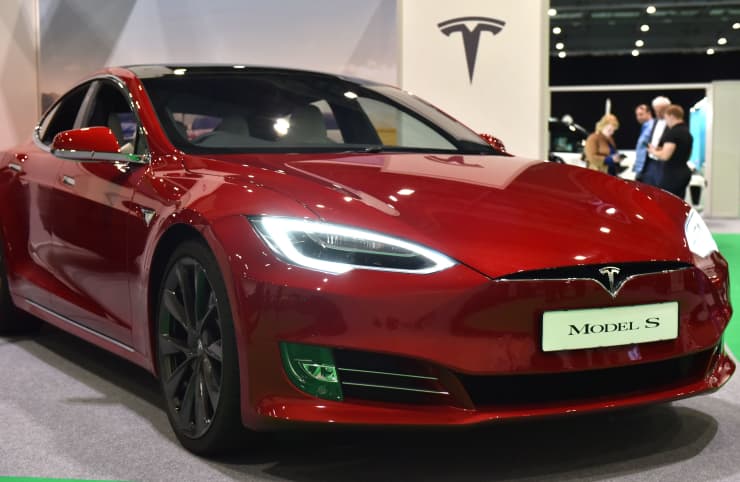
- On Monday, Tesla cut $3,000 from the price of the Model S sedan and $2,000 from the Model X SUV.
- The decreases offset price increases from a month ago when Tesla offered longer battery range and added a new drive system and suspension."
Tesla lowers prices on Models S and X amid stock slump
Tesla has reduced the prices of its two most expensive models, raising concerns about fading interest in its cars and whether the company can generate enough cash to pay all the bills.
On Monday, Tesla cut $3,000 from the price of the Model S sedan and $2,000 from the Model X SUV.
The company said in a statement that it periodically adjusts prices and available options like other car companies. The decreases offset price increases from a month ago when Tesla offered longer battery range and added a new drive system and suspension. The statement didn’t say if slowing sales influenced the decision.
LEARN MORE
TOP WALL ST. BROKER, SETS OUT $10 WORST CASE FOR STOCK